Equipment Set TP 47224: Statistical Process Control (Stand-Alone)
47224Gallery

Description
Build solid students’ skill set in quality control
Quality is a fundamental component of the organizational strategy of most manufacturing companies to remain competitive. Modern industries have turned toward statistical process control (SPC) to control and improve quality.
The Statistical Process Control training package focuses on the practical applications of SPC. With the right combination of hardware, course content and software, future quality control technicians and engineers learn to collect, analyze, and interpret data using SPC tools commonly used in the industry.
Develop know-how applicable to the job market
Through hands-on activities, the Statistical Process Control training package enables instructors to efficiently convey the required knowledge and skills related to SPC. Comprehensive courseware offers a large range of exercises and projects arranged in a sequence of increasing complexity. This approach allows students to reinforce and expand their skills in a fluid way and improves transferability to the workplace. Guided exercises build basic know-how and confidence; realistic projects develop decision-making skills.
Build expertise with the right equipment
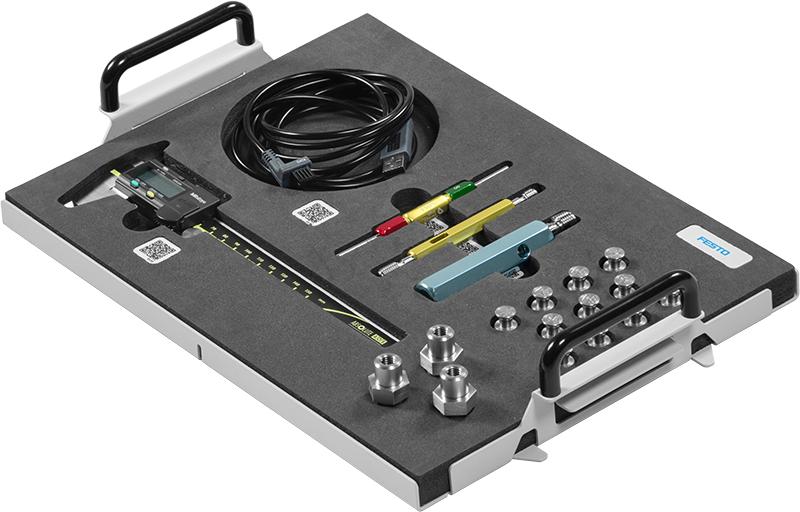
This training package includes measuring instruments and part samples carefully designed to highlight the most important aspects of data collection in the context of SPC. These parts are manufactured to ensure repeatability from one equipment set to another, giving teachers peace of mind when working with multiple sets. Also included are a software and data transmission cable learner will use to recreate a typical industrial data collection and analysis process.
Note
TP 47224, Statistical Process Control (Stand-alone) version does not require any other equipment whereas TP 47224-A, Statistical Process Control (Add-on) requires either TP 47220, Basic Dimensional Metrology (Standard) or TP 47221, Basic Dimensional Metrology (Value). Included measuring instruments and accessories
All the measuring instruments needed to perform the experiments:
• One digital caliper (only included with the Stand-alone version)
• One go/no-go plug gauge
• One go/no-go thread gauge
• One go/no-go pipe thread plug gauge
• One USB cable that automatically transfers measuring data to a SPC software
A complete coverage of dimensional metrology
In order for learners to provide reliable data to apply SPC, they need to correctly handle and read common measuring instruments. Consider Festo’s TP 47220/47221, Basic Dimensional Metrology to enable beginners in the field to have a solid understanding of the fundamentals of dimensional metrology.
Learn more about this complementary learning solution here.
Learning outcomes
• Explain the relationship between quality and variability.
• Explain what a quality characteristic is and give real-life examples.
• Explain the difference between variables data and attributes data.
• Name the seven major tools of Statistical process control (SPC).
• Realize the importance of collecting and summarizing data in the industry.
• Recognize a frequency distribution.
• Identify the class frequencies in a frequency table.
• Identify the absolute and relative frequencies in a frequency table.
• Distribute raw data into class frequencies.
• Identify the main features of a histogram.
• Recognize common measures of central tendency and dispersion used in statistical process control.
• Describe the SPC feature available on some digital calipers.
• Collect variables data from measurements on a given component using a digital caliper equipped with an SPC output.
• Construct frequency distributions based on variables data obtained experimentally.
• Use a spreadsheet software to calculate the range of a data set.
• Construct histograms using a spreadsheet.
• Realize the importance of control charts in industry.
• Recognize a normal distribution curve.
• Identify the variance and mean of a normal distribution curve.
• Explain the properties of the normal distribution.
• Explain what a fluctuating pattern is.
• Explain the difference between natural variation and unnatural variation.
• Explain the difference between special causes and natural causes of variation.
• List the main characteristics of a natural pattern of variation.
• Recognize an x and R control charts.
• Identify the control limits and the center line in x and R control charts.
• Explain what three-sigma control limits are.
• Recognize the structure of the data used to construct x and R control charts.
• Describe the general procedure to construct x and R control charts.
• Describe some visual tests used to analyze x control charts.
• Give examples of special causes for unnatural patterns in x control charts.
• Identify the control limits and the center line of a quality characteristic analyzed with x and R control charts.
• Select the coefficients needed to compute the control limits of x and R control charts according to a sample size.
• Perform visual tests in x and R control charts to detect unnatural patterns of variation.
• Explain what process capability is.
• List the forms to express process capability in industry.
• Explain what a process capability index is.
• List some process capability indices used in industry.
• Interpret the process capability indices Cp, Cpk, Cpl and Cpu
• List the conditions that must be met to interpret process capability indices.
• Relate the process capability indices to the number of defective parts per million (ppm).
• Explain what an attribute is.
• List different types of control charts for attributes.
• List fixed gages used to evaluate attributes on workpieces.
• Identify go/no-go plug gages used in the industry and explain how they are used.
• Explain what the fraction nonconforming control charts are used for.
• Recognize the structure of the data used to construct fraction nonconforming control charts.
• Describe the general procedure to construct fraction nonconforming control charts.
• Recognize a fraction nonconforming control chart.
• Identify the center line and the control limits in a fraction nonconforming control chart.
• Inspect attributes of a workpiece using go/no-go plug gages.
• Identify the control limits and center line of a fraction nonconforming control chart.
• Use fraction nonconforming control charts to determine whether a process is in statistical control.
• Explain what acceptance sampling is.
• Explain what a sampling plan is.
• List different types of sampling plans.
• Name the components of a single-sampling plan for attributes.
• Define producer's risk and consumer's risk.
• Name the four considerations to set a single-sampling plan.
• Identify the elements of a Cameron table.
• Recognize a thread go/no-go plug gage used to check internal threads.
• Explain the use of thread go/no-go plug gages to check internal threads.
• Recognize an L1 plug gage for NPT threads.
• Explain the use of an L1 plug gage for NPT threads.
• Inspect threaded holes using thread go/no-go plug gages.
• Set a single-sampling plan for attributes. Also order student manuals and instructor guides which includes:
• Guided exercises to build know-how
• Projects to develop decision making skills
• Activities to reinforce transversal skills
Additional equipment required to perform the exercises (Purchased separately)
| Qty | Description | Model Number |
|---|---|---|
| 1 | Systainer® with T-LOC system Size I | 80222-9 |
| 1 | Campus Licence, Statistical Process Control (SPC) | 81650-2 |

